Deploy Failure Detection and Automated Rollback Triggering
True automated rollback requires health checks, deployment history.
What "automated rollback" means as a system, not a single command
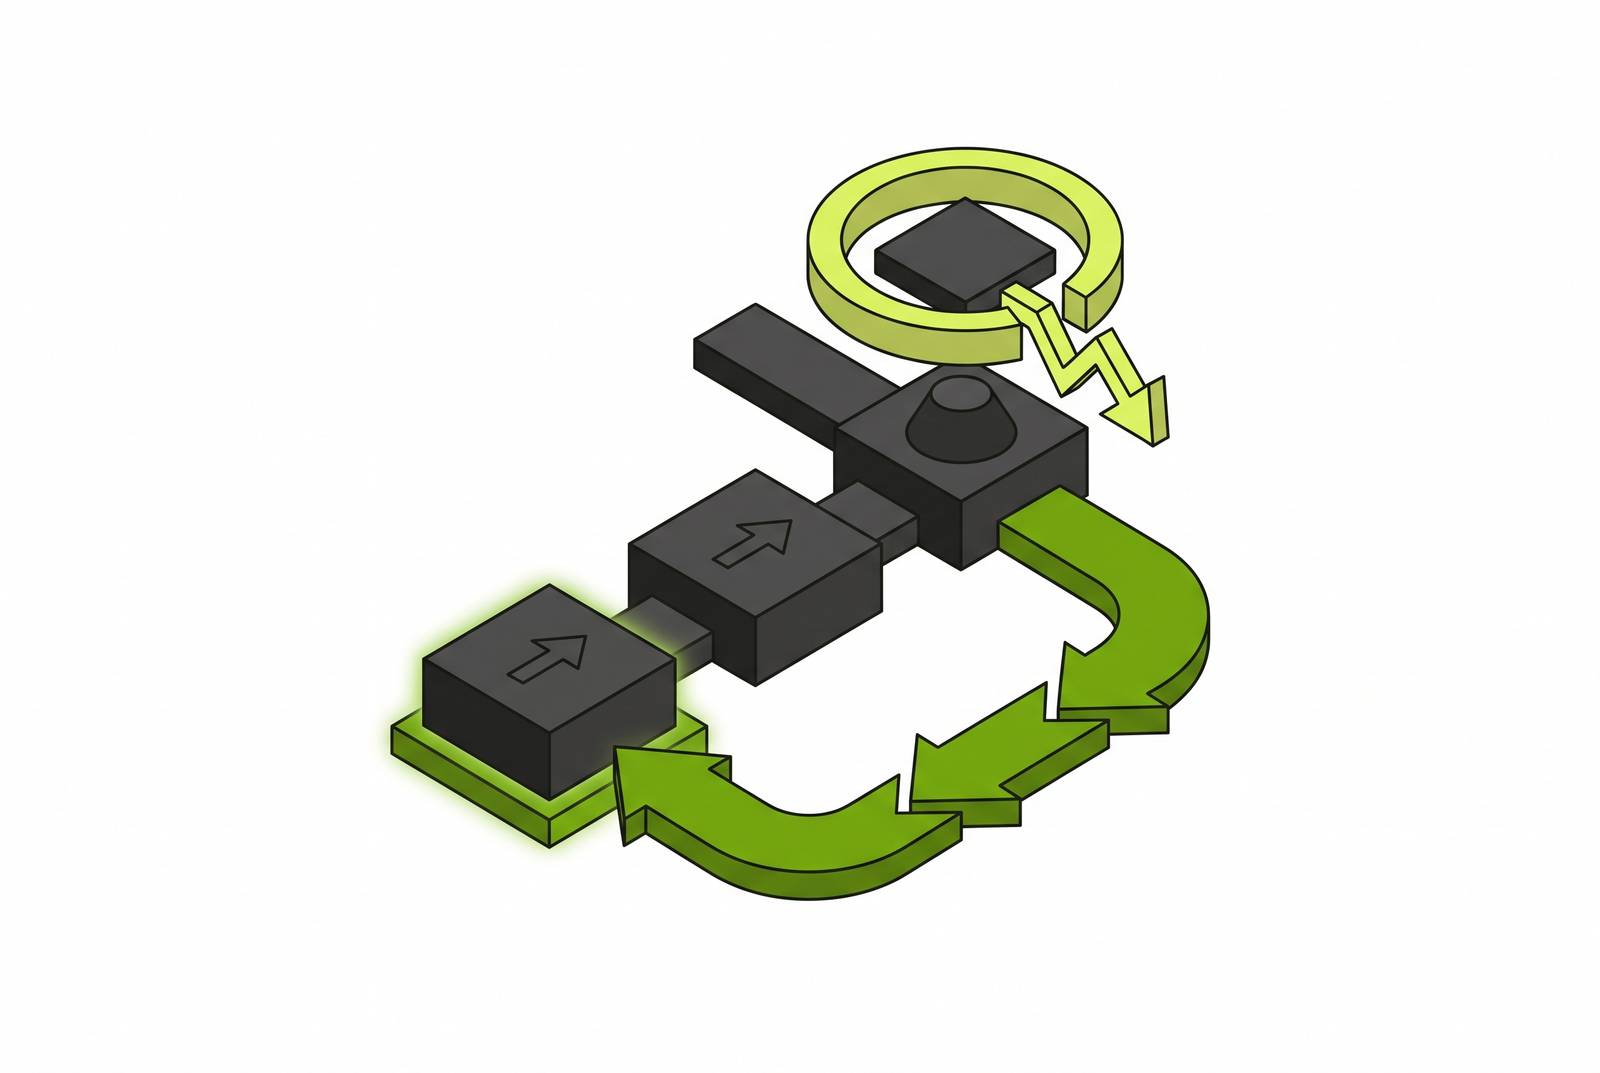
Automated rollback is a wired system: health checks, deployment history, and a trigger connecting the two, acting before a human ever reads an alert. Most teams get this backwards. They build faster detection and call it automation, but recovery speed depends on whether a person is still in the loop at the moment of decision. Skipping that step changes the math on deployment risk.
The manual sequence is familiar to anyone who's carried a pager. Someone gets paged, wakes up, connects to the VPN, tries to remember the right rollback command under stress, and executes it, hopefully without a typo that makes things worse. Each step in that chain adds latency, and each one is a place where a tired engineer at 3 AM can make the wrong call. The AWS Well-Architected Framework flags this directly as an anti-pattern: systems not built for smaller, frequent releases struggle to reverse bulk changes cleanly. The worst case it describes is a manual deploy that only reveals itself as broken during post-deploy testing, forcing a rollback after customers are already disconnected.
Detection lag doesn't scale linearly with damage. It compounds. Every minute a bad deploy stays live means more users hit the broken path, more writes land in a database the old code can't read, more state that has to get unwound by hand afterward. A five-minute detection lag paired with a thirty-second rollback is a non-event. A thirty-minute detection lag with that same thirty-second rollback is an incident report, a postmortem, and a Slack channel full of people asking why nobody caught it sooner.
Automated rollback breaks down into three components working together: health checks that actually detect failure, deployment history that retains a known-good version to fall back to, and a trigger connecting the two without a human in the loop. If any one of those is dropped, the system only looks automated. A health check that fires an alert to a Slack channel is not automated rollback. It's manual rollback with a faster pager. Detection got quicker, but response time never moved, because a person still has to read the alert, judge it, and type the command.
Scoping this correctly means separating two mechanisms that get confused constantly: canary deployments and feature flags. A feature flag toggles a code path for a subset of users instantly, with no deploy involved, and rolling it back means flipping the flag off. A canary routes a percentage of live traffic to a new deployed binary and compares its telemetry against the stable version running alongside it, and rolling that back means re-routing traffic away from the canary. Plenty of teams run both at once: canary the deployment to validate the binary itself is sound, then use flags to control which features inside that binary are actually turned on. They solve different problems. Conflating them is how rollback logic ends up half-built, watching the wrong signal for the wrong kind of change.
Weak signal behind the trigger is the most common failure point in the rollback systems that exist today, more common than a bad kubectl command or a missing revision history. The rest of this piece builds that signal stack from the ground up before circling back to how it gets wired into a trigger.
The signal stack: which production indicators are worth wiring to a rollback trigger
The golden signals framework, latency, traffic, errors, and saturation, gives a workable lens for organizing what to watch. A bad deploy either makes things slower, breaks things outright, chokes on load it used to handle, or changes the traffic pattern hitting downstream services. Those four categories cover most of what a deployment can do wrong. OpenTelemetry has become the vendor-neutral standard for instrumenting all four, collecting metrics, logs, and traces without locking a team into one vendor's proprietary agent.
Inside Kubernetes, there are three probe types, and casual conversation flattens them together in a way that causes real damage. Liveness probes check whether a container is still running correctly; when one fails, Kubernetes restarts the container, not the deployment. Readiness probes check whether a container is ready to take traffic; when one fails, the pod gets pulled from service endpoints, and this is the probe that matters most for automated rollback during a deploy. Startup probes exist to protect slow-starting applications, disabling liveness and readiness checks until the app has actually finished initializing, so a legitimately slow boot doesn't get mistaken for a crash.
Readiness failures on newly deployed pods are the trigger point. The mistake is treating liveness failures as interchangeable with readiness failures, and it appears broadly in half-built rollback logic. Liveness failures point to a different class of problem, usually something wrong with an individual container's runtime state, not the deployment as a whole. Wiring a rollback trigger to liveness failures risks rolling back over problems that a container restart, not a deployment revert, is the appropriate response to.
Metrics extend the picture past what probes alone catch. An error rate threshold, say, anything above 1% on HTTP 5xx responses over a defined window, catches regressions that pass every health check but still degrade real traffic. A p95 latency ceiling catches the same class of problem from a different angle: a service that responds correctly but slowly enough to violate its own response-time target. Probes check whether a pod exists in a healthy state. Metrics check whether the traffic actually flowing through it looks normal. Both are needed, because a deploy can pass every probe and still be quietly broken for a meaningful share of users.
Prometheus, Datadog, New Relic, and Azure Monitor all collect this kind of data reliably, and the choice between them matters far less than what a team does with the output once it's flowing. A perfectly instrumented Prometheus setup wired to nothing is just an expensive dashboard.
Get the probes configured correctly first, before anything else. Layering rollback automation on top of missing or misconfigured probes doesn't add safety. It adds false negatives: a system that looks automated but silently fails to catch the thing it was built to catch.
Kubernetes-native rollback mechanics
Kubernetes gives real infrastructure for this, but it stops well short of the finish line. kubectl rollout undo reverts a deployment to a previous revision using the deployment's own history, and revisionHistoryLimit controls how many of those previous revisions stay available. Keeping several on hand, rather than pruning aggressively, is the operational baseline for quick recovery.
Rolling update parameters shape the blast radius of a bad deploy in progress. Setting maxSurge: 1 and maxUnavailable: 0 means Kubernetes brings up exactly one new pod at a time and never reduces total capacity while doing it, so a bad rollout doesn't take down the whole fleet on its way in. minReadySeconds adds a stability requirement on top of that: a new pod has to hold a passing readiness state for a defined window before it counts as ready, which stops a pod that's flapping between healthy and unhealthy from getting counted as a success. And progressDeadlineSeconds marks the whole deployment as failed if it doesn't make forward progress within that window, catching a rollout where pods simply never become ready.
Kubernetes will mark a deployment failed. It will not undo it. That gap is the entire reason external automation exists: a deployment can sit marked as failed while production traffic keeps routing to degraded pods, because nothing in the platform itself is watching that failed status and deciding to intervene.
Two approaches close that gap in practice, and they're not equivalent, whatever the tooling documentation implies by presenting them side by side. The first bolts rollback logic onto the CI/CD pipeline itself, where a script watches rollout status after a deploy and calls kubectl rollout undo if that status comes back failed, essentially a progressive rollout with a safety net built into the pipeline stage. The second builds a custom controller that runs continuously inside the cluster, monitoring deployment health on an ongoing basis and triggering rollbacks against configurable thresholds.
The pipeline approach checks health at one moment, right after deploy, and then stops watching. The controller approach watches indefinitely. That difference matters most in production environments where a deployment can look fine initially and then degrade under load conditions that weren't present at deploy time, a failure mode a one-time pipeline check will simply miss. Anyone building for that scenario should default to the controller, not the pipeline script, and treat the pipeline-only approach as a stopgap at best.
Wiring signals to triggers in a CI/CD pipeline
The pipeline's job here is narrow but exacting: watch the deployment as it rolls out, validate pod health once it completes, query real metrics under real traffic, and call rollback the moment any one of those checks fails, without pausing for a human to read an alert first.
A pattern that shows up across CI/CD pipeline configurations structures this as three gates, each one a hard stop if it fails. The first gate checks rollout status directly: kubectl rollout status runs with a timeout, and its exit code tells the pipeline whether the rollout actually succeeded or stalled out. Gate two checks pod readiness once the rollout reports complete, counting how many replicas are actually ready and failing the pipeline step if any of them aren't. Gate three is metrics validation: after a soak window under live traffic, the pipeline queries Prometheus for error rate and exits non-zero if it breaches its configured threshold.
A failure at any gate triggers the same rollback sequence. The pipeline pulls the previous revision from rollout history, calls kubectl rollout undo, waits on rollout status again to confirm the stable version has come back up fully, and checks that ready replica count matches the desired count before marking the step complete. Nothing in that sequence requires a person to be awake.
Google Cloud Deploy offers a higher-level version of the same idea for teams on GKE. Verification steps run after each deployment phase through Skaffold verify jobs, and a repairRolloutRule inside the Automation resource defines what happens on failure: retry some configurable number of times with a wait in between, then roll back to the last known stable phase if retries don't resolve it. Canary percentages sharpen this further. Rolling out to 10% of traffic first means an automated rollback triggered at that stage catches the failure while it's still only affecting a tenth of users, not all of them.
GitOps tooling like Flux CD expresses the same logic differently. Instead of an imperative kubectl command, the rollback is a Git operation, either an automatic Helm rollback or a Git revert. The signal feeding the trigger stays the same class of thing either way; only the mechanism of the rollback itself changes.
None of this is complete without notification. The pipeline needs to tell the team a rollback happened, immediately, typically through something as simple as a Slack webhook fired the moment the rollback step finishes. That way, investigation into root cause starts while the system is already stable again, not while it's still degraded and someone's still trying to figure out what broke.
Threshold calibration: what makes a rollback trigger fire at the right moment
Badly calibrated thresholds fail in two opposite directions, and both are common enough to have names among the people who deal with them. Setting thresholds too sensitively causes a transient metric spike or a flapping readiness check to roll back a perfectly good deployment, training the team to distrust the automation and eventually ignore it. Setting them too leniently allows real degradation to slide through every gate cleanly while users absorb the damage before anything fires.
The leniency error is worse. A rollback system nobody trusts gets quietly disabled during the next incident, at exactly the moment it's needed, and that failure mode is harder to catch because it looks like the system is working right up until it doesn't.
minReadySeconds acts as a stability buffer against the false-positive side. Requiring a pod to hold a passing readiness state for a defined window before it counts as ready filters out the transient restart that would otherwise register as a false success. The metrics soak window does similar work on the other side of the pipeline: waiting a stretch of time after rollout completes, before querying error rate and latency, gives traffic time to normalize and keeps startup noise from tripping the trigger.
Probe configuration carries its own version of this balance. A readiness probe set to failureThreshold: 3 with periodSeconds: 5 means a pod has to fail three consecutive checks across 15 seconds before Kubernetes pulls it from service, enough to filter out a single noisy check without masking a real, sustained problem. Startup probes lean the other direction on purpose, using a high failure threshold specifically to protect applications that are slow to boot from getting killed before they've had a fair chance to come up.
Set health check timeouts aggressively, detecting real failure in seconds rather than minutes, but pair that aggressiveness with failure-count buffers so a momentary blip doesn't get treated the same as sustained degradation.
None of these thresholds mean anything until they've actually been tested. A rollback path that's never been exercised outside of production is a rollback path that will fail exactly when it's needed most. Scheduled rollback drills, run on a regular cadence rather than only after an incident, are the only real way to confirm that a given threshold catches the failure mode it was set up to catch.
Production signals in agentic pipelines: why the stakes are higher when agents are deploying
Agentic tools have moved past autocomplete into multi-step autonomous workflows, where an agent writes code, opens a pull request, runs its own tests, and moves through a CI/CD pipeline without waiting on a human between steps. Stack Overflow's 2025 Developer Survey put the number using or planning to use AI-assisted programming at 84%, and the character of that assistance has shifted from suggestion toward autonomous execution over that time.
That shift changes the math on deployment risk in one direction: worse. Agents operating in execution loops push changes faster and more often than human-paced release cycles typically allow, which shrinks the window between a bad deploy and its detection while simultaneously growing the raw number of deploys that could turn out bad. Volume and velocity rise together, and neither one waits for the other.
There's a security dimension here that's specific to agentic code, and it deserves more weight than the velocity story usually gets. Bunnyshell's guide to agentic development cites a striking figure: 40 to 62% of AI-generated code contains security flaws. An agent pushing code at that rate is, in a real sense, running untrusted code at production scale. A production signal catching a bad deploy is very often also catching something with a latent security problem baked into it. The rollback trigger is doing double duty whether anyone designed it that way or not.
The governance stakes follow directly from that. A flawed architectural decision made by an autonomous agent can scale across a system before anyone notices the reasoning that produced it, demanding strong circuit breakers and clean audit trails built in from the start, not bolted on after a bad incident.
Automated rollback functions as that circuit breaker. When an agent-driven deploy trips a health check failure or breaches a metric threshold, the rollback system recovers on its own, without waiting for a human to notice and interpret an alert first. That's the circuit breaker pattern, applied directly to deployment risk rather than to some abstract notion of agent behavior.
A second loop appears here too. The specific signal that triggered a rollback, which probe failed, which metric breached, at what threshold, is information an agent can consume going into its next iteration. Instead of that signal sitting quietly in a dashboard, it becomes feedback that closes the loop between what the deployment actually did and what the agent tries next.
Agentic pipelines built on solid CI/CD and GitOps foundations turn agent velocity into a real advantage. Pipelines without those foundations just generate failures faster, and rollback automation is the load-bearing part of what makes a foundation strong enough to support that kind of velocity safely. Skipping that infrastructure and adding agents on top means the agents will find the gap faster than any human on-call rotation would have.
Operational practices that keep the rollback system trustworthy over time
Rollback systems decay quietly, and that's the uncomfortable part nobody likes to plan for. Thresholds get set once during an incident postmortem and never revisited as traffic patterns shift underneath them. Probe endpoints get deleted during a refactor and nobody notices, because the probe only fails silently the next time it's actually needed. The automation just stops working without announcing that it's stopped.
Scheduled rollback drills are the only reliable defense against that drift, and they need to run on a calendar, not only in response to something breaking. A drill is the one way to confirm the entire chain, detection, trigger, undo, verification, notification, still functions end to end. A rollback path that's never been tested in anything resembling production conditions is a rollback path nobody should trust when it counts.
Retaining a defined number of previous versions, rather than pruning aggressively to save storage, guarantees a rollback target actually exists when a trigger fires. Database migrations need to stay backward compatible with the prior application version too, because a rollback that restores the old binary against a schema that binary can no longer read is a second incident wearing the first one's clothes.
Every rollback event deserves a structured log: what triggered it, which revision it targeted, how long the full recovery took. That log feeds post-incident analysis afterward, and in an agentic pipeline, it also feeds directly back into the agent's next planning cycle.
Notification design closes the loop. The team should hear that a rollback happened before anyone stumbles onto it independently, and an immediate alert in Slack or an incident channel means the investigation into root cause starts while the system has already stabilized, not while it's still actively degraded.
Teams running software factories at real scale get more out of rollback infrastructure that talks to their merge queue and CI signal layer directly, so a rollback event surfacing there keeps the same broken commit from re-entering the pipeline while the underlying cause is still being worked out. Rollback, in that frame, is a feedback signal the rest of the pipeline can act on. It's a feedback signal the rest of the pipeline can act on.