Engineering Velocity Metrics That Reflect Agent Contributions
Old velocity metrics fail as AI agents flood pipelines with code that doesn't ship.

Engineering teams built their velocity dashboards on PRs merged, lines written, and commits pushed. Those numbers now point in the wrong direction: the same dashboards that once signaled progress are recording more activity while less of it reaches production.
Why the metrics engineering teams built their velocity dashboards on no longer work
Feature-branch throughput rose sharply year over year, but main-branch throughput for the median team fell, and main-branch success rates dropped to their lowest point in more than five years. More code gets written. Less of it lands. That single fact undoes the logic behind a decade of engineering dashboards, because those dashboards were built on the assumption that writing and shipping moved together.
Lines of code, PRs merged per week, and commit counts were never a clean measure of value, even before any of this. They counted motion, not results. A team could always game them somewhat, but the distortion stayed within a tolerable range because a human being still had to type every line. That constraint is gone. When agents generate code at machine speed, raw volume climbs by default: a team running three agents can multiply its PR count without shipping anything a user actually benefits from. Developer Productivity Benchmarks 2026 states that traditional metrics are unreliable in 2026 precisely because AI-assisted workflows inflate volume without a corresponding increase in delivered value.
This could be a temporary adjustment period, the kind of dip a team expects while it learns new tools, or something more permanent. The data says the latter. The DX Q2 2026 AI Impact report shows the Developer Experience Index has declined over four consecutive quarters as AI adoption rose. Four quarters is a trend line that points toward a structural mismatch between how fast agents can produce code and how fast an organization can absorb it.
What the throughput gap reveals about where work is getting stuck
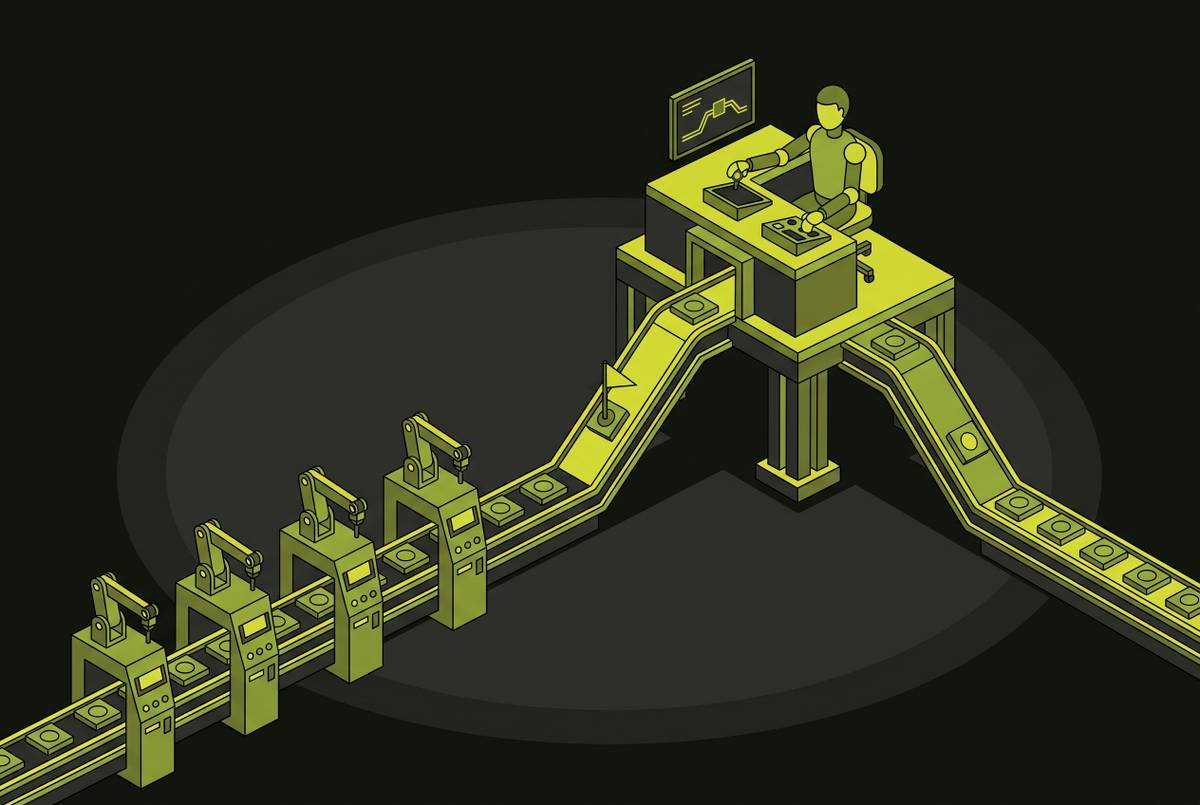
The gap between branches being written and code reaching main is a queueing problem, and it sits downstream of where most teams are looking.
Agents raise the rate at which pull requests arrive for review, but the review and merge pipeline's capacity to process them stays fixed. Basic queueing behavior explains what happens next: once arrivals approach that fixed capacity, wait times do not grow in proportion, they grow much faster. KORE1's Engineering Velocity Benchmark Report 2026 puts the median cycle time at seven days, with more than half of that time spent waiting in review rather than being built. AI-assisted pull requests are also larger: at the 75th percentile, they run significantly bigger than unassisted ones, and they wait 5.3 times longer for a reviewer to pick them up. Bigger PRs take longer to review per unit, and they also arrive more often. Both pressures land on the same bottleneck at once.
The pipeline doesn't just slow down, it produces worse outcomes once a reviewer finally engages: bot-authored code gets accepted at a far lower rate than human-authored code. The queue isn't only holding more work, it's generating more rework loops on top of it.
Anthropic's own engineering organization ran into this directly. Agents wrote most of a much larger volume of code each quarter, and CI job volume grew roughly twenty-five fold in six months even though headcount stayed nearly flat. So they turned to test impact analysis, to keep the feedback loop from collapsing under its own volume. Uber's experience with flaky tests shows how fragile these pipelines can be even without agents in the picture: a small fraction of unreliable tests across a large monorepo was enough to keep the mainline below the green rate needed to ship safely. Instructed simply to "get the PR merged," agents will re-queue repeatedly against that same flakiness, turning a minor reliability issue into something closer to a denial-of-service attack on the merge queue.
None of this points to agents producing too much code. It points to merge infrastructure built for a world where contribution speed was capped by human typing. Once that cap disappears, the question is no longer how to measure output but which signals actually show where the system is straining.
The five-dimension framework that replaces volume counting
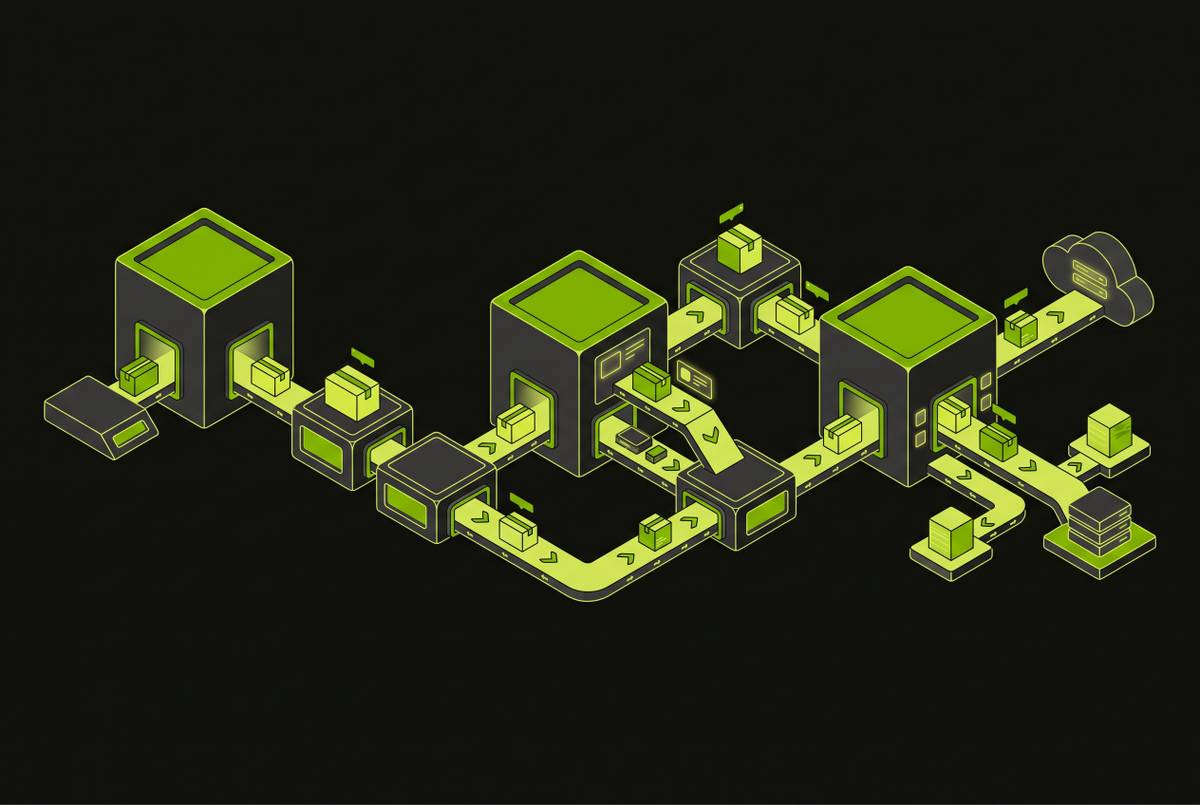
A useful picture of agent-assisted velocity needs signals across five dimensions at once: adoption, AI code share, complexity-adjusted throughput, code quality, and cost and ROI. Measuring fewer than three of them produces an incomplete view that a team can quietly game. Developer Productivity Benchmarks 2026 names these five explicitly as the Developer AI Impact Framework, and the benchmark data behind them is built around all five together, not any one pillar on its own.
Adoption covers more than tool access. Weekly active usage and power-user density act as a leading indicator, because when a team has a high share of daily, multi-feature users, adoption tends to rise and the outcome data gets cleaner. AI code share, the proportion of committed code that was agent- or AI-assisted, needs to be tracked apart from adoption, because a team can show heavy tool usage while keeping code share low if agents are mostly handling documentation or boilerplate. DX Q2 2026 found that AI code share crossed majority share that quarter after accelerating sharply from Q1, and at that level, code share turns into a vanity metric if it isn't matched with quality data.
Complexity-adjusted throughput assigns weighted point values to pull requests by difficulty, easy, medium, hard, instead of counting every PR the same. This is the one metric that separates a team doing genuinely hard work faster from a team doing easy work more often. Code quality centers on turnover rate, the share of AI-generated code reverted, deleted, or substantially rewritten within 30 and 90 days, alongside the AI versus Human Turnover Ratio. Cost and ROI track token and usage costs per engineer per month, and these have grown large enough that AI spend needs a direct line to downstream outcomes, or it draws budget scrutiny with nothing to answer it. Waydev's 2026 Intelligence Report organizes its own measurement stack around a comparable set: decision velocity, AI contribution by tool, policy adherence rates, agent behavioral anomaly tracking, and a full ROI stack running through to board-level reporting.
DORA metrics such as deployment frequency, lead time for changes, change failure rate, and time to restore service remain the baseline for deployment pipeline health, and change failure rate now needs to distinguish agent-authored CI/CD changes from human-authored ones, since the two have meaningfully different merge and reliability profiles.
Why code turnover rate is the quality signal that volume metrics bury
Turnover rate, how much AI-generated code gets reverted, deleted, or substantially rewritten, is the earliest reliable sign that an agent is producing code faster than the surrounding system can absorb it.
Code churn on AI-assisted code was climbing before agent-first workflows became standard practice, and that trajectory continued as AI code share expanded. Escaped defects, production incidents that appear after AI-generated code merges and slip past internal quality gates, serve as the lagging half of the same signal. Faros 2026 Telemetry found incidents per pull request have risen sharply, and the probability of a production incident tied to any given merged change has more than tripled. Metadata-only tools miss this connection entirely, because it only becomes visible at the code-diff level.
Code Maintainability improved in the same quarter that Change Confidence decreased. AI is making codebases easier to read while making the engineers working in them less sure that any given change won't break something. Turnover rate is what puts a number on that trust gap instead of leaving it as a feeling.
There's a related pattern in how time gets spent. The innovation ratio, the share of engineering time going to new features versus maintenance and overhead, stayed flat even as AI users reported saving an estimated 4 to 6 hours per week. Time saved generating code appears to be getting absorbed by cleanup and rework elsewhere, and turnover rate is the metric that can confirm or rule out that explanation.
Some churn is healthy in any codebase, AI-assisted or not. What matters is the ratio between AI-generated churn and human-generated churn, not the absolute churn number. A healthy baseline exists for both kinds of code, and the ratio tells a team whether AI is adding a disproportionate cleanup burden on top of that baseline.
That answer only matters if the data behind it exists. Turnover rate has to come from somewhere, and most teams do not currently collect it at the resolution this framework requires.
What teams need to instrument before these metrics are usable
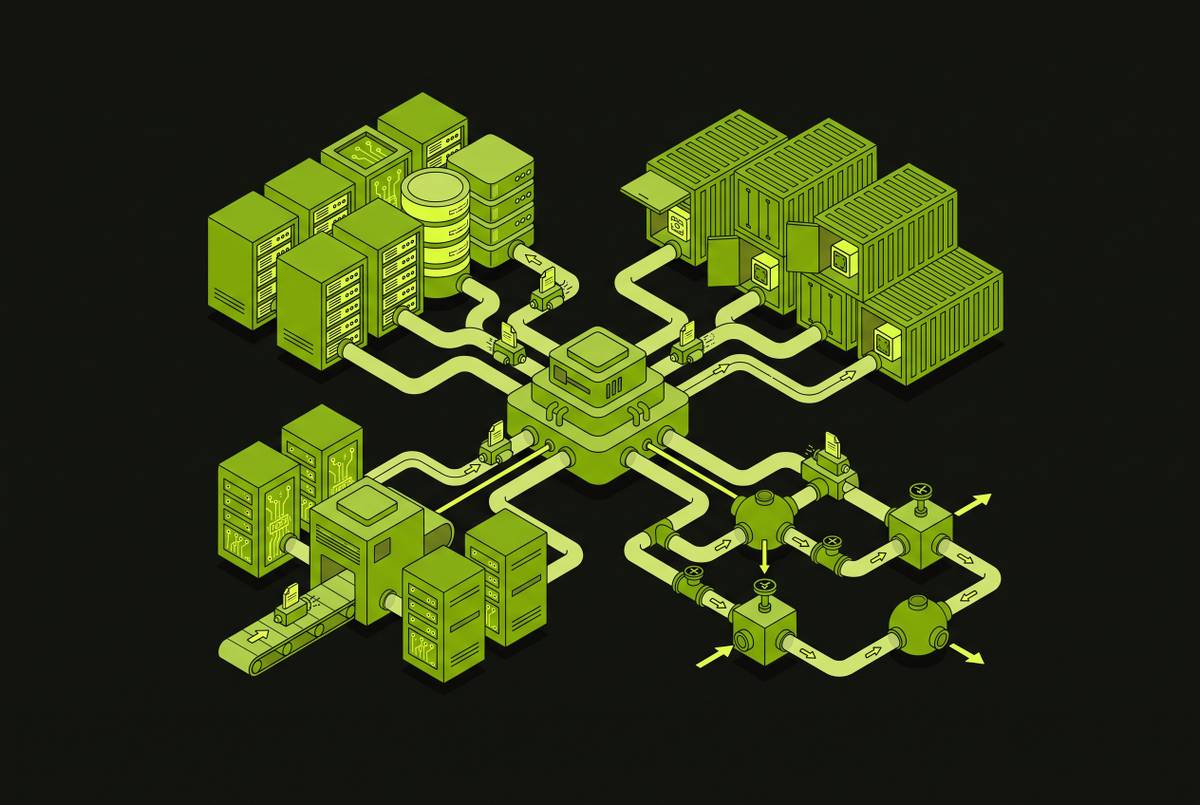
Most engineering organizations can pull throughput and adoption numbers from tools already in place. The quality and behavioral signals that actually distinguish agent contributions from human ones require instrumentation at the transcript and diff level, and most developer analytics platforms on the market were not built to capture that.
Tool-agnostic diff analysis is the starting point. Telling AI-touched commits apart from human-authored ones, across multiple agents, inline assistants, and autonomous PR authors running at the same time, requires detection that works on the code itself rather than relying on tool metadata. Exceeds AI builds this as diff mapping that works across Cursor, Claude Code, GitHub Copilot, Windsurf, and other tools, and the underlying principle is that measurement cannot depend on which agent wrote the code.
Agent behavior forms its own category of signal, separate from code quality. Waydev's 2026 report lists policy adherence rate, behavioral anomaly tracking, and audit cadence adherence as part of a complete AI measurement stack, and together they can catch an agent operating outside its intended parameters before that behavior reaches production. The Digital Applied 12-KPI framework organizes this kind of instrumentation across five domains: deploy, eval, incident, cost, and governance, and the argument there is that a team needs all five running together. Improving one domain in isolation tends to create blind spots elsewhere, faster deploys that quietly raise incident rates, or a lower cost per task that masks declining quality.
Transcript-level data opens up a behavioral layer, and you can't reach it through diff analysis alone. Seeing how agents actually use the tools available to them, which skills get called, which never get invoked, where context windows overflow, is a kind of signal that aggregate PR metrics simply cannot capture. Agent transcript analysis is what makes that visible at scale. Teams running several agent harnesses at once can normalize those transcripts into one common record format to compare behavior across tools: Letta's trajectory library, built in July 2026, normalizes session transcripts from fifteen different harnesses into a single validated format.
None of this replaces DORA metrics, deployment frequency, lead time for changes, change failure rate, time to restore service, which remain the baseline for deployment pipeline health. They need an update for the agent era: change failure rate now has to distinguish agent-authored CI/CD changes from human-authored ones, because the two carry meaningfully different merge and reliability profiles.
The perception problem: why self-reported and aggregate metrics overstate agent gains
Collecting the right signals is not the hardest part of this problem. Correcting for the bias that makes engineering teams believe AI is helping more than the objective data shows is harder.
The clearest evidence of that bias comes from a randomized controlled trial run by METR. Experienced open-source developers completed tasks both with and without AI tools, and when they used AI assistance, they were 19% slower. Before each task, they predicted a substantial speedup. After finishing and experiencing the slowdown firsthand, they still believed AI had made them faster. That result deserves to be taken at face value: it is a real study with a real finding, and it should make any team skeptical of productivity claims that rest on developer self-report.
It does not, however, undercut the five-dimension framework. It confirms exactly the weakness that framework was built to correct, which is the unreliability of self-report and aggregate counts as measurement tools. Developers are not lying when they say AI made them faster after being measurably slower. They are experiencing a consistent cognitive bias that the tooling itself appears to reinforce.
There's a further complication: the comparison group that used to make this bias checkable is disappearing. DX Q2 2026 notes that AI adoption is now near-universal across the industry, so a non-user control group no longer exists for comparison. Before/after longitudinal tracking at the code and outcome level is what's left as a reliable approach. KORE1's benchmark report adds a related wrinkle: a large share of developers actively distrust AI accuracy even while reporting that it made them more productive. Using a tool and trusting it are different things, and trusting it is different again from having verified its output is actually good.
AI tools do work, but the gains are uneven across teams, task types, and individual agents, and the only way to find where they are real is to track turnover rate, escaped defects, and complexity-adjusted throughput over time rather than asking developers how productive they feel. Agent-authored CI/CD changes, for instance, merge slightly less often than other agent-authored pull requests, except in specific tool configurations favoring infrastructure tasks. Variation at that level of detail is invisible to any aggregate metric and only appears in diff-level analysis.
Reading the metrics together
No single dimension in this framework means much read alone. Adoption climbing without a matching rise in AI code share suggests agents are being used for trivial tasks, documentation, boilerplate, small fixes, rather than substantive engineering work. AI code share climbing past majority share, as DX Q2 2026 recorded, means very little without turnover rate and escaped defects tracked alongside it, since high code share paired with rising churn is a warning sign dressed up as a success metric.
Complexity-adjusted throughput needs to be read against code quality specifically. A team posting strong weighted-point gains while turnover rate climbs is moving fast on harder tickets and leaving a larger cleanup bill behind it, exactly the pattern the innovation ratio data suggests is already happening industry-wide, where time saved on generation gets consumed by rework rather than redirected toward new features. Cost and ROI figures only mean something once connected to the other four. A favorable cost-per-outcome number built on a code base with rising escaped defects is not a success story but a bill that hasn't arrived yet.
Diff-level analysis, transcript data, and policy adherence tracking exist to catch the gap between what aggregate dashboards show and what's actually happening in the code and in the agents producing it. The DORA baseline still anchors deployment health, but change failure rate split by agent versus human authorship is what reveals whether velocity gains are coming from genuine capability or from a pipeline absorbing more risk than it reports.
When teams track quality signals alongside velocity figures, they consistently outperform the ones chasing speed in isolation, and that is not a coincidence. It is what happens when a measurement system finally matches the thing it claims to describe.